Category Archives: works

actual works, projects

A HTML GUI for training Tesseract on character sets

The Tesseract OCR Chopper, by data journalist Dino Beslagic.

I’m making this short stub post because ever since I’ve used tesseract to convert scanned documents into text, I’ve wondered why the hell is it so hard to train tesseract (to make it better at recognizing a font)? As it turns out, Beslagic created a web-app that makes the task comparatively easy and platform-independent.

He recently updated it but posted it about 2 years ago. I can’t believe I didn’t find it until now. How did I find it? By stumbling upon the “AddOns” wiki for the Tesseract project. I love Tesseract but am surprised at how such a useful and popular utility can have such scattered resources.

Tools to get to the precipice of programming

I’m not a master programmer but it’s been so long since I’ve done my first “Hello World” that I don’t remember how people first grok the point of programming (for me, it was to get a good grade in programming class).

So when teaching non-programmers the value of code, I’m hoping there’s an even friendlier, shallower first step than the many zero-to-coder references out there, including Zed Shaw’s excellent Learn Code the Hard Way series.

Not only should this first step be “easy”, but nearly ubiquitous, free-to-use, and most importantly: has immediate benefit for both beginners and experts. The point here is not to teach coding, per se, but to get them to a precipice of great things. So that when they stand at the edge, they can at least see something to program towards, even if the end goal is simply labor-aversion, i.e. “I don’t want to copy-and-paste 100 web page tables by hand.”

Here are a few tools I’ve tried:

Inspecting a cat photo

1. Using the web inspector – I’ve never seen the point of taking an indepth HTML class (unless you want to become a full-time web designer/developer, and even then…) because so many non-techies even grasp that webpages are (largely) text, external multimedia assets (such as photos and videos), and the text that describes where those assets come from. To them, editing a webpage is as arcane as compiling a binary.

Nothing breaks that illusion better than the web inspector. Its basic element-inspector and network panel illustrates immediately the “magic” behind the web. As a bonus, with regular, casual use, the inspector can teach you the HTML and CSS vocabulary if you do intend to be a developer. It’s hard to think of another tool that is as ubiquitous and easy to use as the web inspector, yet as immensely useful to beginner and expert alike.

Its uses are immediate, especially for anyone who’s ever wanted to download a video from YouTube. To journalists, I’ve taught how this simple-to-use tool has helped me in my investigative reporting when I needed to find an XML file that was obfuscated through a Flash object.

In a hands-on class I taught, a student asked “So how do I get that XML into Excel?” – and that’s when you can begin to describe the joy of a basic for loop.

Here’s an overview of a hands-on web session I taught at NICAR12. Here’s the guide I wrote for my ProPublica project. And here’s the first of a multi-part introduction to the web inspector.

Refine WH Visitors

2. Google Refine – Refine is a spreadsheet-like software that allows you to easily explore and clean data: the most common example is resolving varied entries (“JOHN F KENNEDY”, “John F. Kennedy”, “Jack Kennedy”, “John Fitzgerald Kennedy”) into one (“John F. Kennedy”). Given that so many great investigative stories and data projects start with “How many times does this person’s name appear in this messy database?”, its uses are immediate and obvious.

Refine is an open-source tool that works out of the web browser and yet is such a powerful point-and-click interface that I’m happy to take my data out of my scripted workflow in order to use Refine’s features on it. Not only can you use regular expressions to help filter/clean your data, you can write full-on scripts, making Refine a pretty good environment to show some basic concepts of code (such as variables and functions).

I wrote a guide showing how Refine was essential for one of my investigative data projects. Refine’s official video tutorial is also a great place to start.

3. Regular Expressions – maybe it was because my own comsci curriculum skipped regexes, leaving me to figure out their worth much much later than I should have. But I really try to push learning regexes every time the following questions are asked:

  • In Excel, how do I split this “last_name, first_name middle_name” column into three different columns?
  • In Excel, how do I get all these date formats to be the same?
  • In Excel, how do I extract the zip code from this address field?

…and so on. The use of LEFT, TRIM, RIGHT, etc. functions seem to always be much more convoluted than the regex needed to do this kind of simple parsing. And while regexes aren’t the answer to every parsing problem, they sure deliver a lot of return for the investment (which can start from a simple cheat sheet next to your computer).

Regular-expressions.info has always been one of my favorite references. Zed Shaw is also writing a book on regexes. I’ve also written a lengthy tutorial on regexes.

So none of these tools or concepts involve programming…yet. But they’re immediately useful on their own, opening new doors to useful data just enough to interest beginners into going further. In that sense, I think these tools make for an inviting introduction towards learning programming.

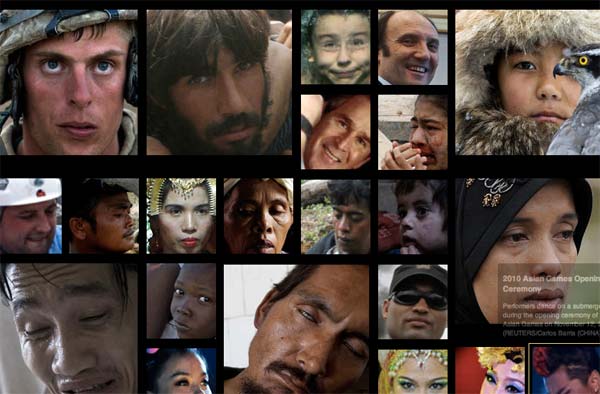
Big Faces – a mashup of The Big Picture and Face.com

Big Faces

Just put up another quick side project: Big Faces, which aggregates the excellent Big Picture Blog (by the Boston Globe and its many contributors) and just shows the faces. I used the Face.com API to crop the faces before uploading them.

I have in mind a multi-level photo-exploration app but because it’s been so long since I looked at using Backbone.js, I needed some practice. As it is, the fine work of the photographers and curators associated with The Big Picture stands on its own power. I probably should rethink it so it doesn’t require a 700K JSON download…

The process is simliar to the Congressmiles demo I did last week.

On the front end, this uses the excellent isotope JQuery plugin. It also has Backbone.js though I vastly simplified the project so much that I pretty much ditched using any of Backbone’s useful features. The Backbone boilerplate was extremely helpful, though, in organizing the project.

Analyzing the U.S. Senate Smiles: A Ruby tutorial with the Face.com and NYT Congress APIs

U.S. Senate Smiles, ranked by Face.com face-detection algorithm

The smiles of your U.S. Senate from most smiley-est to least, according to Face.com's algorithm

Who’s got the biggest smile among our U.S. senators? Let’s find out and exercise our Ruby coding and civic skills. This article consists of a quick coding strategy overview (from the full code is at my Github). Or jump here to see the results, as sorted by Face’s algorithm.

About this tutorial

This is a Ruby coding lesson to demonstrate the basic features of Face.com’s face-detection API for a superficial use case. We’ll mash with the New York Times Congress API and data from the Sunlight Foundation.

The code comprehension is at a relatively simple level and is intended for learning programmers who are comfortable with RubyGems, hashes, loops and variables.

If you’re a non-programmer: The use case may be a bit silly here but I hope you can view it from an abstract-big-picture level and see the use of programming to: 1) Make quick work of menial work and 2) create and analyze datapoints where none existed before.

On to the lesson!

The problem with portraits

For the SOPA Opera app I built a few weeks ago, I wanted to use the Congressional mugshots to illustrate
the front page. The Sunlight Foundation provides a convenient zip file download of every sitting Congressmember’s face. The problem is that the portraits were a bit inconsistent in composition (and quality). For example, here’s a usable, classic head-and-shoulders portrait of Senator Rand Paul:

Sen. Rand Paul

But some of the portraits don’t have quite that face-to-photo ratio; Here’s Sen. Jeanne Shaheen’s portrait:

Sen. Jeanne Shaheen

It’s not a terrible Congressional portrait. It’s just out of proportion compared to Sen. Paul’s. What we need is a closeup crop of Sen. Shaheen’s face:

Sen. Jeanne Shaheen's face cropped

How do we do that for a given set of dozens (even hundreds) of portraits that doesn’t involve manually opening each image and cropping the heads in a non-carpal-tunnel-syndrome-inducing manner?

Easy face detection with Face.com’s Developer API

Face-detection is done using an algorithm that scans an image and looks for shapes proportional to the average human face and containing such inner shapes as eyes, a nose and mouth in the expected places. It’s not as if the algorithm has to have an idea of what an eye looks like exactly; two light-ish shapes about halfway down what looks like a head might be good enough.

You could write your own image-analyzer to do this, but we just want to crop faces right now. Luckily, Face.com provides a generous API that when you send it an image, it will send you back a JSON file in this format:

{
    "photos": [{
        "url": "http:\/\/face.com\/images\/ph\/12f6926d3e909b88294ceade2b668bf5.jpg",
        "pid": "F@e9a7cd9f2a52954b84ab24beace23046_1243fff1a01078f7c339ce8c1eecba44",
        "width": 200,
        "height": 250,
        "tags": [{
            "tid": "TEMP_F@e9a7cd9f2a52954b84ab24beace23046_1243fff1a01078f7c339ce8c1eecba44_46.00_52.40_0_0",
            "recognizable": true,
            "threshold": null,
            "uids": [],
            "gid": null,
            "label": "",
            "confirmed": false,
            "manual": false,
            "tagger_id": null,
            "width": 43,
            "height": 34.4,
            "center": {
                "x": 46,
                "y": 52.4
            },
            "eye_left": {
                "x": 35.66,
                "y": 44.91
            },
            "eye_right": {
                "x": 58.65,
                "y": 43.77
            },
            "mouth_left": {
                "x": 37.76,
                "y": 61.83
            },
            "mouth_center": {
                "x": 49.35,
                "y": 62.79
            },
            "mouth_right": {
                "x": 57.69,
                "y": 59.75
            },
            "nose": {
                "x": 51.58,
                "y": 56.15
            },
            "ear_left": null,
            "ear_right": null,
            "chin": null,
            "yaw": 22.37,
            "roll": -3.55,
            "pitch": -8.23,
            "attributes": {
                "glasses": {
                    "value": "false",
                    "confidence": 16
                },
                "smiling": {
                    "value": "true",
                    "confidence": 92
                },
                "face": {
                    "value": "true",
                    "confidence": 79
                },
                "gender": {
                    "value": "male",
                    "confidence": 50
                },
                "mood": {
                    "value": "happy",
                    "confidence": 75
                },
                "lips": {
                    "value": "parted",
                    "confidence": 39
                }
            }
        }]
    }],
    "status": "success",
    "usage": {
        "used": 42,
        "remaining": 4958,
        "limit": 5000,
        "reset_time_text": "Tue, 24 Jan 2012 05:23:21 +0000",
        "reset_time": 1327382601
    }
}		
	

The JSON includes an array of photos (if you sent more than one to be analyzed) and then an array of tags – one tag for each detected face. The important part for cropping purposes are the attributes dealing with height, width, and center:

		"width": 43,
      "height": 34.4,
      "center": {
          "x": 46,
          "y": 52.4
      },	
	

These numbers represent percentage values from 0-100. So the width of the face is 43% of the image’s total width. If the image is 200 pixels wide, then the face spans 86 pixels.

Using your favorite HTTP-calling library (I like the RestClient gem), you can simply ping the Face.com API’s detect feature to get these coordinates for any image you please.

Image manipulation with RMagick

So how do we do the actual cropping? By using the RMagick (a Ruby wrapper for the ImageMagick graphics library) gem, which lets us do crops with commands as simple as these:

img = Magick::Image.read("somefile.jpg")[0]

# crop a 100x100 image starting from the top left corner
img = img.crop(0,0,100,100) 

The RMagick documentation page is a great place to start. I’ve also written an image-manipulation chapter for The Bastards Book of Ruby.

The Process

The code for all of this is stored at my Github account.

I’ve divided this into two parts/scripts. You could combine it into one script but to make things easier to comprehend (and to lessen the amount of best-practices error-handling code for me to write), I divide it into a “fetch” and “process” stage.

In the fetch.rb stage, we essentially download all the remote files we need to do our work:

  • Download a zip file of images from Sunlight Labs and unzip it at the command line
  • Use NYT’s Congress API to get latest list of Senators
  • Use Face.com API to download face-coordinates as JSON files

In the process.rb stage, we use RMagick to crop the photos based from the metadata we downloaded from the NYT and Face.com. As a bonus, I’ve thrown in a script to programmatically create a crude webpage that ranks the Congressmembers’ faces by smile, glasses-wearingness, and androgenicity. How do I do this? The Face.com API handily provides these numbers in its response:

	"attributes": {
            "glasses": {
                "value": "false",
                "confidence": 16
            },
            "smiling": {
                "value": "true",
                "confidence": 92
            },
            "face": {
                "value": "true",
                "confidence": 79
            },
            "gender": {
                "value": "male",
                "confidence": 50
            },
            "mood": {
                "value": "happy",
                "confidence": 75
            },
            "lips": {
                "value": "parted",
                "confidence": 39
            }
        }
	

I’m not going to reprint the code from my Github account, you can see the scripts yourself there:

https://github.com/dannguyen/Congressmiles

First things first: sign up for API keys at the NYT and Face.com

I also use the following gems:

The Results

Here’s what you should see after you run the process.rb script (all judgments made by Face.com’s algorithm…I don’t think everyone will agree with about the quality of the smiles):


10 Biggest Smiles

Sen. Wicker (R-MS)
Sen. Wicker (R-MS) [100]
Sen. Reid (D-NV)
Sen. Reid (D-NV) [100]
Sen. Shaheen (D-NH)
Sen. Shaheen (D-NH) [99]
Sen. Hagan (D-NC)
Sen. Hagan (D-NC) [99]
Sen. Snowe (R-ME)
Sen. Snowe (R-ME) [98]
Sen. Kyl (R-AZ)
Sen. Kyl (R-AZ) [98]
Sen. Klobuchar (D-MN)
Sen. Klobuchar (D-MN) [98]
Sen. Crapo (R-ID)
Sen. Crapo (R-ID) [98]
Sen. Johanns (R-NE)
Sen. Johanns (R-NE) [98]
Sen. Hutchison (R-TX)
Sen. Hutchison (R-TX) [98]


10 Most Ambiguous Smiles

Sen. Inouye (D-HI)
Sen. Inouye (D-HI) [40]
Sen. Kohl (D-WI)
Sen. Kohl (D-WI) [43]
Sen. McCain (R-AZ)
Sen. McCain (R-AZ) [47]
Sen. Durbin (D-IL)
Sen. Durbin (D-IL) [49]
Sen. Roberts (R-KS)
Sen. Roberts (R-KS) [50]
Sen. Whitehouse (D-RI)
Sen. Whitehouse (D-RI) [52]
Sen. Hoeven (R-ND)
Sen. Hoeven (R-ND) [54]
Sen. Alexander (R-TN)
Sen. Alexander (R-TN) [54]
Sen. Shelby (R-AL)
Sen. Shelby (R-AL) [62]
Sen. Johnson (D-SD)
Sen. Johnson (D-SD) [63]

The Non-Smilers

Sen. Bingaman (D-NM)
Sen. Bingaman (D-NM) [79]
Sen. Coons (D-DE)
Sen. Coons (D-DE) [77]
Sen. Burr (R-NC)
Sen. Burr (R-NC) [72]
Sen. Hatch (R-UT)
Sen. Hatch (R-UT) [72]
Sen. Reed (D-RI)
Sen. Reed (D-RI) [71]
Sen. Paul (R-KY)
Sen. Paul (R-KY) [71]
Sen. Lieberman (I-CT)
Sen. Lieberman (I-CT) [59]
Sen. Bennet (D-CO)
Sen. Bennet (D-CO) [55]
Sen. Udall (D-NM)
Sen. Udall (D-NM) [51]
Sen. Levin (D-MI)
Sen. Levin (D-MI) [50]
Sen. Boozman (R-AR)
Sen. Boozman (R-AR) [48]
Sen. Isakson (R-GA)
Sen. Isakson (R-GA) [41]
Sen. Franken (D-MN)
Sen. Franken (D-MN) [37]


10 Most Bespectacled Senators

Sen. Franken (D-MN)
Sen. Franken (D-MN) [99]
Sen. Sanders (I-VT)
Sen. Sanders (I-VT) [98]
Sen. McConnell (R-KY)
Sen. McConnell (R-KY) [98]
Sen. Grassley (R-IA)
Sen. Grassley (R-IA) [96]
Sen. Coburn (R-OK)
Sen. Coburn (R-OK) [93]
Sen. Mikulski (D-MD)
Sen. Mikulski (D-MD) [93]
Sen. Roberts (R-KS)
Sen. Roberts (R-KS) [93]
Sen. Inouye (D-HI)
Sen. Inouye (D-HI) [91]
Sen. Akaka (D-HI)
Sen. Akaka (D-HI) [88]
Sen. Conrad (D-ND)
Sen. Conrad (D-ND) [86]


10 Most Masculine-Featured Senators

Sen. Bingaman (D-NM)
Sen. Bingaman (D-NM) [94]
Sen. Boozman (R-AR)
Sen. Boozman (R-AR) [92]
Sen. Bennet (D-CO)
Sen. Bennet (D-CO) [92]
Sen. McConnell (R-KY)
Sen. McConnell (R-KY) [91]
Sen. Nelson (D-FL)
Sen. Nelson (D-FL) [91]
Sen. Rockefeller IV (D-WV)
Sen. Rockefeller IV (D-WV) [90]
Sen. Carper (D-DE)
Sen. Carper (D-DE) [90]
Sen. Casey (D-PA)
Sen. Casey (D-PA) [90]
Sen. Blunt (R-MO)
Sen. Blunt (R-MO) [89]
Sen. Toomey (R-PA)
Sen. Toomey (R-PA) [88]


10 Most Feminine-Featured Senators

Sen. McCaskill (D-MO)
Sen. McCaskill (D-MO) [95]
Sen. Boxer (D-CA)
Sen. Boxer (D-CA) [93]
Sen. Shaheen (D-NH)
Sen. Shaheen (D-NH) [93]
Sen. Gillibrand (D-NY)
Sen. Gillibrand (D-NY) [92]
Sen. Hutchison (R-TX)
Sen. Hutchison (R-TX) [91]
Sen. Collins (R-ME)
Sen. Collins (R-ME) [90]
Sen. Stabenow (D-MI)
Sen. Stabenow (D-MI) [86]
Sen. Hagan (D-NC)
Sen. Hagan (D-NC) [81]
Sen. Ayotte (R-NH)
Sen. Ayotte (R-NH) [79]
Sen. Klobuchar (D-MN)
Sen. Klobuchar (D-MN) [79]

For the partisan data-geeks, here’s some faux analysis with averages:

Party Smiles Non-smiles Avg. Smile Confidence
D 44 7 85
R 42 5 86
I 1 1 85

There you have it, the Republicans are the smiley-est party of them all.

Further discussion

This is an exercise to show off the very cool Face.com API and to demonstrate the value of a little programming knowledge. Writing the script doesn’t take too long, though I spent more time than I liked on idiotic bugs of my own making. But this was way preferable than cropping photos by hand. And once I had the gist of things, I not only had a set of cropped files, I had the ability to whip up any kind of visualization I needed with just a minute’s more work.

And it wasn’t just face-detection that I was using, but face-detection in combination with deep data-sources like the Times’s Congress API and the Sunlight Foundation. For the SOPA Opera app, it didn’t take long at all to populate the site with legislator data and faces. (I didn’t get around to using this face-detection technique to clean up the images, but hey, I get lazy too…)

Please don’t judge the value of programming by my silly example here – having an easy-to-use service like Face.com API (mind the usage terms, of course) gives you a lot of great possibilities if you’re creative. Off the top of my head, I can think of a few:

  • As a photographer, I’ve accumulated thousands of photos but have been quite lazy in tagging them. I could conceivably use Face.com’s API to quickly find photos without faces for stock photo purposes. Or maybe a client needs to see male/female portraits. The Face.com API gives me an ad-hoc way to retrieve those without menial browsing.
  • Data on government hearing webcasts are hard to come by. I’m sure there’s a programmatic way to split up a video into thousands of frames. Want to know at which points Sen. Harry Reid shows up? Train Face.com’s API to recognize his face and set it loose on those still frames to find when he speaks.
  • Speaking of breaking up video…use the Face API to detect the eyes of someone being interviewed and use RMagick to detect when the eyes are closed (the pixels in those positions are different in color than the second before) to do that college-level psych experiment of correlating blinks-per-minute to truthiness.

Thanks for reading. This was a quick post and I’ll probably go back to clean it up. At some point, I’ll probably add this to the Bastards Book.

A Million Pageviews, Thousands of Dollars Poorer, and Still Countlessly Richer.

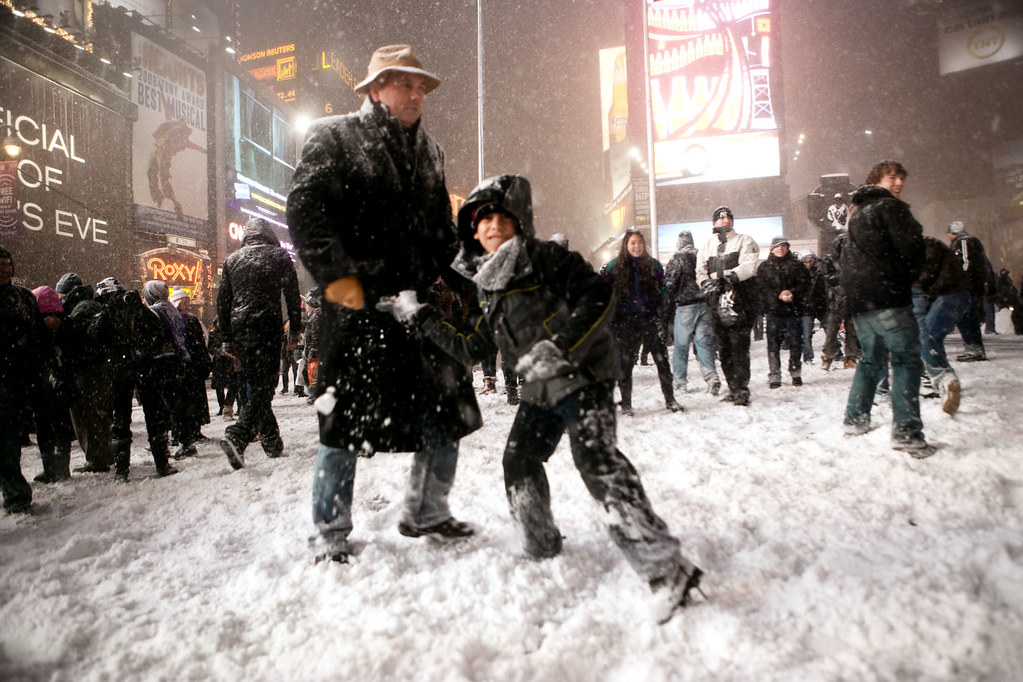
Snowball fight in Times Square, Manhattan, New York

Update: This post rambled longer than I intended it to and I forgot that I had meant to include some observations on what I’ve noticed about Flickr’s traffic pattern. I’ve added some grafs to the bottom of this post.

My Flickr account hit 1,000,000 pageviews this weekend. Two years ago, I bought a Pro account shortly after the above photo of some punk kid throwing a snowball at me in Times Square was posted on Flickr’s blog. Since then I set my account to share all of my photos under the Creative Commons Non-commercial license (but I’ve let anyone who asks use them for free).

My account was on track to have 500K pageviews by October (of this past year) but then this photo of pilots marching on Wall Street hit Reddit and attracted 150K views all by itself, so then a million total views seemed just around the corner :).

Net Profit

Mermaid Parade 2010, Coney Island

I was paid $120 for this photo, which was used in New York’s campaign to remind people that they can’t smoke in Coney Island (or any other public park).


So how much have I gained monetarily in these two years of paying for a Flickr Pro account?

Two publications offered a total of $135 for my work. Minus the two years of Pro fees ($25 times 2 years) and that comes to about $80. If I spent at minimum 1 minute to shoot, edit, process, and upload each of my ~3,100 photos, I made a rate of $1.50/hour for my work.

Of course, I’ve spent much more time than one minute per photo. And I’ve taken far more than 3,100 photos (I probably have 15 to 20 times as many stored on my backup drives). And of course, thousands of dollars for my photo equipment, including repairs and replacements. So:

  • + $135 from publications
  • – $50 for Flickr Pro fees
  • – $8,000 (and change) for Canon 5D Mark 2, Canon S90, lenses, repairs from constant use in the rain/snow/etc.

So doing the math…I’m several thousands of dollars in the hole.

Gains

Monetarily, my photography is a large loss for me. I’m lucky enough to have a job (and, for better or worse, no car or mortgage and few other hobbies to pay for) to subsidize it. So why do I keep doing it and, in general, giving away my work for free?

Well, there is always the promise of potential gain:

  • I made a $1,000 (mostly to cover expenses) to shoot a friend’s wedding because his fiance liked the work I posted on my Facebook account…but weddings are so much work that I’ve decided to avoid shooting them if I can help it.
  • I’ve also taken photos for my job at ProPublica, including this portrait for a story that was published in the Washington Post. I’m not employed specifically to take photos, but it’s nice to be able to do it on office time.
  • I also now have a large cache of stock photos to use for the random sites I build. For example, I used the Times Square snowball photo to illustrate a programming lesson on image manipulation and face-recognition technology.
  • Even if my photos were up to professional par, I’m not the type to declare (in person) to others, “Hey, one of my hobbies is photography. Look at these pictures I took.” Flickr/Facebook/Tumblr is a nice passive-humblebrag way to show this side passion to others. And I’ve made a few good friends and new opportunities because of the visibility of my work.

In the scheme of things, a million pageviews is not a lot for two years…A photo might get that in a few days if it’s a popular enough meme. And pageviews have only a slight correlation to actual artistic merit (neither the above snowball or pilot photos are my favorite of the series). But it’s amazing and humbling to think that – if the average visitor who stumbles on my account might look at 4 photos – something I’ve done as a hobby might have reached nearly a quarter million people (not counting the times when sites take advantage of the CC-licensing and reprint my photos).

Having any kind of audience, no matter how casual, is necessary to practice improve my art if I were to ever try to become a paid professional photographer. So that’s one important way that I’m getting something from my online publishing.

Photos are as free as the photographer wants them to be

My personal milestone coincidently comes after the posting of two highly-linked-to articles on the costs of a photo: This Photograph is Not Free by John Mueller and This Photograph is Free by Tristan Nitot. They both make good points (Mueller’s response to Nitot is nuanced and deserves to also be considered).

Mueller and Nitot aren’t necessarily at odds at each other so there’s not much for me to add. Photos are worth good money. To cater to a client, to buy the (extra) professional equipment, to spend more time in editing and post-processing (besides cropping, color-correction and contrast, I don’t do much else to my photos), to take more time to be there at an assignment – this is all most definitely worth charging for.

And that is precisely why I don’t put the effort into marketing or selling mine. The money isn’t worth taking that amount of time and energy from what I currently consider my main work and passion. However, what I’ve gotten so far from my photography – the extra incentive to explore the great city I live in, the countless friends and memories, and of course, the photos to look back on and reuse for whatever I want – the $8,000 deficit is easily covered by that. Having the option to easily share my photos to (hopefully) inspire and entertain others is icing.

One more side-benefit of using a public publishing system like Flickr: I couldn’t devise a better way to organize and browse my own work with minimal effort. And I’m often rediscovering what I considered to be throwaway photos because others find them interesting.

Here are a few other photos I’ve taken over the years that were either frequently-viewed or considered “interesting” by Flickr’s bizarre algorithm:

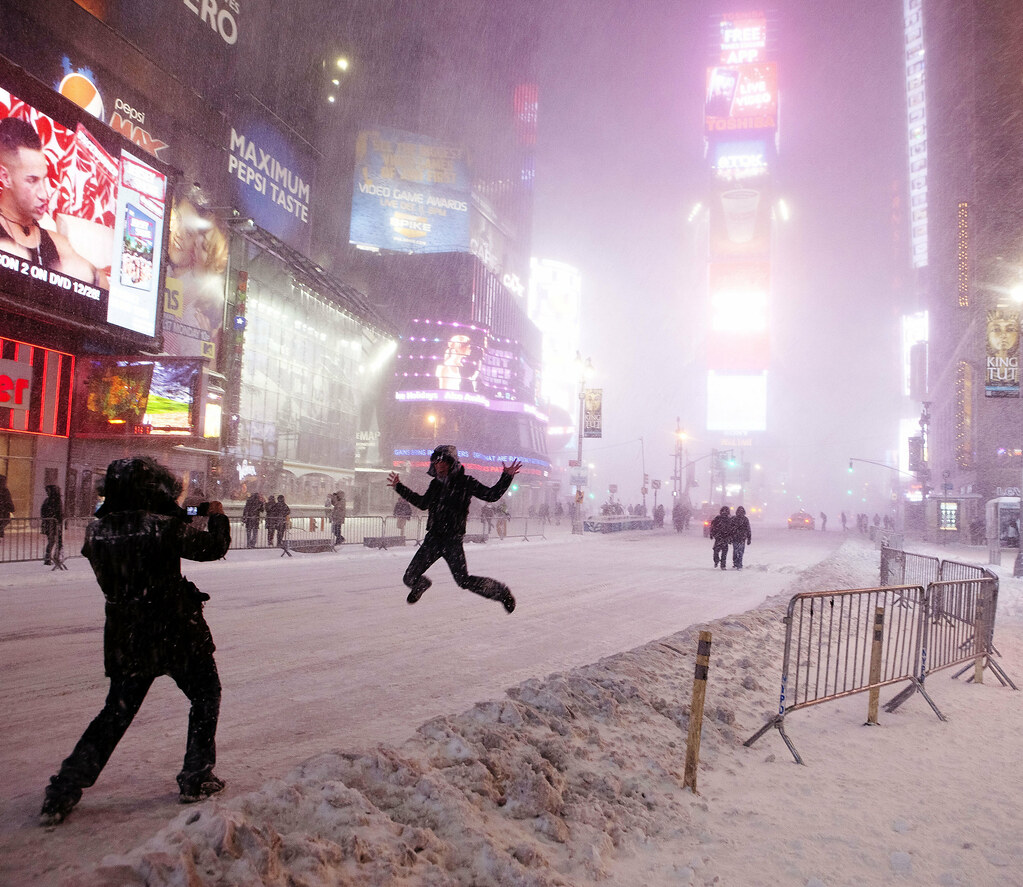
Jumping for joy during New York blizzard, Times Square
The Cat is the Hat
Sunset over Battery Park and Statue of Liberty
Woman in white, pilots
Pushing a Taxi - New York Blizzard Snowstorm Thundersnow Blaaaaagh
Lightning strikes the Empire State Building
Brooklyn Bridge photographer-tourist, Photo of
Atrium, Museum of Natural History
Union Square Show
Casting Couch (#NYFW Spring 2012)
Williamsburg: Beautiful dogs
New York Snow Blizzard 2011, Lone Man on the Brooklyn Bridge
Ground Zero NY celebrates news of Osama bin Laden's death
Grand Central Moncler NYFW Flash Mob Dancin
Broadway Rainstorm
Towers of Light 9/11
Manhattanhenge from a Taxi

A few more observations on Flickr pageviews: It’s hard to say if 1,000,000 page views is a lot especially considering the number of photos I have uploaded in total. Before the pilots on Wall Street photo, I averaged about 200-500 pageviews a day. After that, I put more effort into maintaining my account and regularly uploading photos. Now on a given day, if I don’t upload anything particularly interesting the account averages about 1,500 views.

Search engines bring very little traffic. So other than what (lack of) interest my photos have for the general Internet, I think my upload-and-forget mindset towards my account also limits my pageviews. I have a good friend on Flickr who gets far fewer pageviews but gets far more comments than I do. I rarely comment on my contacts’ photos and barely participate in the various groups.

I’m disconnected enough from the Flickr social scene that I only have a very vague understanding of how its Explore section works. Besides the blog, the Explore collection is the best way to get seen on Flickr. It features “interesting” photos as determined by an algorithm that, as best I can tell, is affected by some kind of in-group metric.

I’ve only had three photos make it to Explore: the snowball fight in Times Square, the lightning hitting the Empire State Building, and this one where my subway train got stuck and we had to walk out the tunnel. The pilots photo did not make it to Explore, so I’m guessing that amount of traffic (particularly if a huge portion of it comes from one link on Reddit) is not necessarily a prime factor to getting noticed by Flickr’s algorithm.

SOPAopera.org – A hand-made list of SOPA / PROTECT-IP Congressional supporters and opponents

I’ve always been interested in exploring the various online Congressional information sources and the recent SOPA debate seemed like a good time to put some effort in it…also, I’ve always wanted to try out the excellent isotope Javascript library.

I had been passively paying attention to the debate and was surprised at how hard it was to find a list of supporters and opponents, given how much it’s dominated my (admittedly small bubblish) internet communities.

When I set out to compile the list, though, I could see why…the official government sites don’t make it easy to find or interpret the information. So SOPAopera is my game attempt at putting some basic information about it…the feedback I’ve gotten so far indicates that even constituents who have been reading a lot about SOPA/PROTECT-IP are surprised at the level and diversity of support the laws have among Congressmembers.

The Bastards Book: A Programming Tutorial for journalists, researchers, analysts, and anyone else who cares about data

Crossing Bleecker and Lafayette through a snowstorm

Back when I wrote my “Coding for Journalists 101″ guide about a year and a half ago, I barely realized how useful code could be as a journalistic tool. Since then, after the Dollars for Docs project at ProPublica and various other programming adventures, I’ve become a slightly better coder and even more adamant that programming is basically a necessity for anyone who cares about understanding and communicating about the world in a quantitative, meaningful way.

The world of data has exploded in the past few years without a corresponding increase in the people or tools to efficiently make sense of it. And so I’ve had a hankering to create a more cohesive, useful programming guide aimed at not just journalists, but for anyone in any field.

It’s called the Bastards Book of Ruby. It’s not really just about Ruby and “bastards” was a working title that I came up with but never got around to changing. But it seems to work for now.

As I was writing the introduction (“Programming is for Anyone“), I came across this Steve Jobs interview with Fresh Air. He says pretty much exactly what I’m thinking, but he said it 15 years ago — surprising given that the Web was in its infancy and Jobs’s fame was largely out of making computers brain-dead simple for people. He wasn’t much of a programmer, but he really was a genius at understanding the bigger picture of what he himself only dabbled in:

“In my perspective … science and computer science is a liberal art, it’s something everyone should know how to use, at least, and harness in their life. It’s not something that should be relegated to 5 percent of the population over in the corner. It’s something that everybody should be exposed to and everyone should have mastery of to some extent, and that’s how we viewed computation and these computation devices.”

Bastards Book of Ruby. It’s just a rough draft but already numbers at 75,000 words. See the table of contents.

New Hurricane Irene data predicts increased chance of high speed winds

UPDATE 1:30PM: New NOAA numbers project REDUCED probabilities, table updated:

According to raw data from the National Hurricane Center, the probability that NYC will suffer sustained high winds has increased significantly

I had yesterday's numbers saved on my web cache from yesterday. Here they are compared with this morning's numbers (reports 26 and 28 respectively):

City KT SAT 0200-1400 SAT 1400-SUN 0200 SUN 0200-1400 SUN 1400-MON 0200 MON 0200 - TUE 0200 TUE 0200-WED 0200 WED 0600 - THU 0600
NYC 34 1( 1) 23(24) 44(68) 1(69) X(69) X(69)
NYC 50 X( X) 2( 2) 27(29) X(29) X(29) X(29)
NYC 64 X( X) X( X) 5( 5) X( 5) X( 5) X( 5)
New proj:
NYC 34 1 35(36) 47(83) X(83) X(83) X(83) X(83)
NYC 50 X 3( 3) 41(44) X(44) X(44) X(44) X(44)
NYC 64 X X( X) 10(10) X(10) X(10) X(10) X(10)
NEWER proj (#29):
NYC 34 10 59(69) 5(74) X(74) X(74) X(74) X(74)
NYC 50 X 30(30) 3(33) X(33) X(33) X(33) X(33)
NYC 64 X 5( 5) 1( 6) X( 6) X( 6) X( 6) X( 6)


The KT values are sustained winds (1 minute or longer) measurements. They translate to:

34 39mph
50 58mph
64 74mph

The number in the parentheses is the projected cumulative chance that NYC experiences those wind speeds. The number outside the parentheses are the chance that those wind speeds will occur in the given time period.

How bad are those wind speeds for New York? Nate Silver of the New York Times has a great article and chart showing the projected damage. Summary: It's not good, at all:

Nate Silver Hurricane Irene damage chart

Nate Silver Hurricane Irene damage chart

The NYTimes is keeping a good up-to-date blog of the latest Irene news.

Here's the current NOAA raw data for all the cities (next time around, I'll just make a web app to translate this mess):


000
FONT14 KNHC 271449
PWSAT4

HURRICANE IRENE WIND SPEED PROBABILITIES NUMBER  29                 
NWS NATIONAL HURRICANE CENTER MIAMI FL       AL092011               
1500 UTC SAT AUG 27 2011                                            

AT 1500Z THE CENTER OF HURRICANE IRENE WAS LOCATED NEAR LATITUDE    
35.2 NORTH...LONGITUDE 76.4 WEST WITH MAXIMUM SUSTAINED WINDS NEAR  
75 KTS...85 MPH...140 KM/H.                                         

Z INDICATES COORDINATED UNIVERSAL TIME (GREENWICH)                  
   ATLANTIC STANDARD TIME (AST)...SUBTRACT 4 HOURS FROM Z TIME      
   EASTERN  DAYLIGHT TIME (EDT)...SUBTRACT 4 HOURS FROM Z TIME      
   CENTRAL  DAYLIGHT TIME (CDT)...SUBTRACT 5 HOURS FROM Z TIME      


I.  MAXIMUM WIND SPEED (INTENSITY) PROBABILITY TABLE                

CHANCES THAT THE MAXIMUM SUSTAINED (1-MINUTE AVERAGE) WIND SPEED OF 
THE TROPICAL CYCLONE WILL BE WITHIN ANY OF THE FOLLOWING CATEGORIES 
AT EACH OFFICIAL FORECAST TIME DURING THE NEXT 5 DAYS.              
PROBABILITIES ARE GIVEN IN PERCENT.  X INDICATES PROBABILITIES LESS 
THAN 1 PERCENT.                                                     


      - - - MAXIMUM WIND SPEED (INTENSITY) PROBABILITIES - - -      

VALID TIME   00Z SUN 12Z SUN 00Z MON 12Z MON 12Z TUE 12Z WED 12Z THU
FORECAST HOUR   12      24      36      48      72      96     120  
- - - - - - - - - - - - - - - - - - - - - - - - - - - - - - - - - -
DISSIPATED       X       4       4      10      25      30      31
TROP DEPRESSION  3      19       7      26      31      29      28
TROPICAL STORM  41      56      65      53      41      38      38
HURRICANE       56      21      24      12       3       4       3
- - - - - - - - - - - - - - - - - - - - - - - - - - - - - - - - - -
HUR CAT 1       52      18      21      10       3       3       3
HUR CAT 2        4       2       3       2       X       X       X
HUR CAT 3        1       1       X       X       X       X       X
HUR CAT 4        X       X       X       X       X       X       X
HUR CAT 5        X       X       X       X       X       X       X
- - - - - - - - - - - - - - - - - - - - - - - - - - - - - - - - - -
FCST MAX WIND   70KT    65KT    60KT    45KT    40KT    35KT    35KT


II. WIND SPEED PROBABILITY TABLE FOR SPECIFIC LOCATIONS             

CHANCES OF SUSTAINED (1-MINUTE AVERAGE) WIND SPEEDS OF AT LEAST     
   ...34 KT (39 MPH... 63 KPH)...                                   
   ...50 KT (58 MPH... 93 KPH)...                                   
   ...64 KT (74 MPH...119 KPH)...                                   
FOR LOCATIONS AND TIME PERIODS DURING THE NEXT 5 DAYS               

PROBABILITIES FOR LOCATIONS ARE GIVEN AS IP(CP) WHERE               
    IP  IS THE PROBABILITY OF THE EVENT BEGINNING DURING            
        AN INDIVIDUAL TIME PERIOD (INDIVIDUAL PROBABILITY)          
   (CP) IS THE PROBABILITY OF THE EVENT OCCURRING BETWEEN           
        12Z SAT AND THE FORECAST HOUR (CUMULATIVE PROBABILITY)      

PROBABILITIES ARE GIVEN IN PERCENT                                  
X INDICATES PROBABILITIES LESS THAN 1 PERCENT                       
PROBABILITIES FOR 34 KT AND 50 KT ARE SHOWN AT A GIVEN LOCATION WHEN
THE 5-DAY CUMULATIVE PROBABILITY IS AT LEAST 3 PERCENT.             
PROBABILITIES FOR 64 KT ARE SHOWN WHEN THE 5-DAY CUMULATIVE         
PROBABILITY IS AT LEAST 1 PERCENT.                                  


  - - - - WIND SPEED PROBABILITIES FOR SELECTED  LOCATIONS - - - -  

               FROM    FROM    FROM    FROM    FROM    FROM    FROM 
  TIME       12Z SAT 00Z SUN 12Z SUN 00Z MON 12Z MON 12Z TUE 12Z WED
PERIODS         TO      TO      TO      TO      TO      TO      TO  
             00Z SUN 12Z SUN 00Z MON 12Z MON 12Z TUE 12Z WED 12Z THU

FORECAST HOUR    (12)   (24)    (36)    (48)    (72)    (96)   (120)
- - - - - - - - - - - - - - - - - - - - - - - - - - - - - - - - - - 
LOCATION       KT                                                   

BURGEO NFLD    34  X   X( X)   X( X)   X( X)   6( 6)   X( 6)   X( 6)

PTX BASQUES    34  X   X( X)   X( X)   2( 2)   8(10)   X(10)   X(10)

EDDY POINT NS  34  X   X( X)   X( X)   4( 4)   1( 5)   X( 5)   X( 5)

SYDNEY NS      34  X   X( X)   X( X)   2( 2)   3( 5)   X( 5)   X( 5)

HALIFAX NS     34  X   X( X)   1( 1)   8( 9)   X( 9)   X( 9)   X( 9)

YARMOUTH NS    34  X   X( X)  16(16)   6(22)   X(22)   X(22)   X(22)

MONCTON NB     34  X   X( X)   3( 3)  20(23)   1(24)   X(24)   X(24)

ST JOHN NB     34  X   X( X)  12(12)  18(30)   X(30)   X(30)   X(30)
ST JOHN NB     50  X   X( X)   X( X)   3( 3)   X( 3)   X( 3)   X( 3)

EASTPORT ME    34  X   X( X)  22(22)  16(38)   X(38)   X(38)   X(38)
EASTPORT ME    50  X   X( X)   1( 1)   4( 5)   X( 5)   X( 5)   X( 5)

BAR HARBOR ME  34  X   X( X)  41(41)  12(53)   X(53)   X(53)   X(53)
BAR HARBOR ME  50  X   X( X)   6( 6)   6(12)   X(12)   X(12)   X(12)
BAR HARBOR ME  64  X   X( X)   1( 1)   1( 2)   X( 2)   X( 2)   X( 2)

AUGUSTA ME     34  X   1( 1)  62(63)   7(70)   X(70)   X(70)   X(70)
AUGUSTA ME     50  X   X( X)  18(18)   6(24)   X(24)   X(24)   X(24)
AUGUSTA ME     64  X   X( X)   3( 3)   1( 4)   X( 4)   X( 4)   X( 4)

PORTLAND ME    34  X   5( 5)  67(72)   2(74)   X(74)   X(74)   X(74)
PORTLAND ME    50  X   X( X)  26(26)   2(28)   X(28)   X(28)   X(28)
PORTLAND ME    64  X   X( X)   5( 5)   X( 5)   X( 5)   X( 5)   X( 5)

CONCORD NH     34  X   9( 9)  68(77)   1(78)   X(78)   X(78)   X(78)
CONCORD NH     50  X   X( X)  37(37)   X(37)   X(37)   X(37)   X(37)
CONCORD NH     64  X   X( X)   7( 7)   X( 7)   X( 7)   X( 7)   X( 7)

BOSTON MA      34  X  18(18)  54(72)   X(72)   X(72)   X(72)   X(72)
BOSTON MA      50  X   X( X)  29(29)   X(29)   X(29)   X(29)   X(29)
BOSTON MA      64  X   X( X)   5( 5)   X( 5)   X( 5)   X( 5)   X( 5)

HYANNIS MA     34  X  19(19)  34(53)   X(53)   X(53)   X(53)   X(53)
HYANNIS MA     50  X   X( X)  12(12)   X(12)   X(12)   X(12)   X(12)
HYANNIS MA     64  X   X( X)   1( 1)   X( 1)   X( 1)   X( 1)   X( 1)

NANTUCKET MA   34  X  20(20)  26(46)   X(46)   X(46)   X(46)   X(46)
NANTUCKET MA   50  X   1( 1)   6( 7)   X( 7)   X( 7)   X( 7)   X( 7)
NANTUCKET MA   64  X   X( X)   1( 1)   X( 1)   X( 1)   X( 1)   X( 1)

PROVIDENCE RI  34  X  30(30)  39(69)   1(70)   X(70)   X(70)   X(70)
PROVIDENCE RI  50  X   2( 2)  28(30)   X(30)   X(30)   X(30)   X(30)
PROVIDENCE RI  64  X   X( X)   6( 6)   X( 6)   X( 6)   X( 6)   X( 6)

HARTFORD CT    34  2  39(41)  34(75)   X(75)   X(75)   X(75)   X(75)
HARTFORD CT    50  X   6( 6)  29(35)   X(35)   X(35)   X(35)   X(35)
HARTFORD CT    64  X   X( X)   6( 6)   X( 6)   X( 6)   X( 6)   X( 6)

MONTAUK POINT  34  4  42(46)  23(69)   X(69)   X(69)   X(69)   X(69)
MONTAUK POINT  50  X  11(11)  23(34)   X(34)   X(34)   X(34)   X(34)
MONTAUK POINT  64  X   1( 1)   6( 7)   X( 7)   X( 7)   X( 7)   X( 7)

NEW YORK CITY  34 10  59(69)   5(74)   X(74)   X(74)   X(74)   X(74)
NEW YORK CITY  50  X  30(30)   3(33)   X(33)   X(33)   X(33)   X(33)
NEW YORK CITY  64  X   5( 5)   1( 6)   X( 6)   X( 6)   X( 6)   X( 6)

NEWARK NJ      34  9  53(62)   5(67)   X(67)   X(67)   X(67)   X(67)
NEWARK NJ      50  X  21(21)   2(23)   X(23)   X(23)   X(23)   X(23)
NEWARK NJ      64  X   3( 3)   1( 4)   X( 4)   X( 4)   X( 4)   X( 4)

TRENTON NJ     34 15  45(60)   2(62)   X(62)   X(62)   X(62)   X(62)
TRENTON NJ     50  X  16(16)   X(16)   X(16)   X(16)   X(16)   X(16)
TRENTON NJ     64  X   2( 2)   X( 2)   X( 2)   X( 2)   X( 2)   X( 2)

ATLANTIC CITY  34 44  38(82)   X(82)   X(82)   X(82)   X(82)   X(82)
ATLANTIC CITY  50  1  42(43)   X(43)   X(43)   X(43)   X(43)   X(43)
ATLANTIC CITY  64  X   7( 7)   X( 7)   X( 7)   X( 7)   X( 7)   X( 7)

BALTIMORE MD   34 26   9(35)   X(35)   X(35)   X(35)   X(35)   X(35)

DOVER DE       34 54  20(74)   1(75)   X(75)   X(75)   X(75)   X(75)
DOVER DE       50  2  20(22)   X(22)   X(22)   X(22)   X(22)   X(22)
DOVER DE       64  X   2( 2)   X( 2)   X( 2)   X( 2)   X( 2)   X( 2)

ANNAPOLIS MD   34 35  10(45)   1(46)   X(46)   X(46)   X(46)   X(46)

WASHINGTON DC  34 26   7(33)   X(33)   X(33)   X(33)   X(33)   X(33)

OCEAN CITY MD  34 83   9(92)   X(92)   X(92)   X(92)   X(92)   X(92)
OCEAN CITY MD  50 43  26(69)   X(69)   X(69)   X(69)   X(69)   X(69)
OCEAN CITY MD  64  5   9(14)   X(14)   X(14)   X(14)   X(14)   X(14)

RICHMOND VA    34 57   1(58)   X(58)   X(58)   X(58)   X(58)   X(58)

NORFOLK NAS    34 99   X(99)   X(99)   X(99)   X(99)   X(99)   X(99)
NORFOLK NAS    50 71   X(71)   X(71)   X(71)   X(71)   X(71)   X(71)
NORFOLK NAS    64  6   X( 6)   X( 6)   X( 6)   X( 6)   X( 6)   X( 6)

NORFOLK VA     34 99   X(99)   X(99)   X(99)   X(99)   X(99)   X(99)
NORFOLK VA     50 84   X(84)   X(84)   X(84)   X(84)   X(84)   X(84)
NORFOLK VA     64 10   X(10)   X(10)   X(10)   X(10)   X(10)   X(10)

GREENSBORO NC  34  4   X( 4)   X( 4)   X( 4)   X( 4)   X( 4)   X( 4)

RALEIGH NC     34 12   1(13)   X(13)   X(13)   X(13)   X(13)   X(13)

CAPE HATTERAS  34 99   X(99)   X(99)   X(99)   X(99)   X(99)   X(99)
CAPE HATTERAS  50 99   X(99)   X(99)   X(99)   X(99)   X(99)   X(99)
CAPE HATTERAS  64 99   X(99)   X(99)   X(99)   X(99)   X(99)   X(99)

CHARLOTTE NC   34  3   X( 3)   X( 3)   X( 3)   X( 3)   X( 3)   X( 3)

MOREHEAD CITY  34 99   X(99)   X(99)   X(99)   X(99)   X(99)   X(99)
MOREHEAD CITY  50 99   X(99)   X(99)   X(99)   X(99)   X(99)   X(99)
MOREHEAD CITY  64 14   X(14)   X(14)   X(14)   X(14)   X(14)   X(14)

WILMINGTON NC  34 99   X(99)   X(99)   X(99)   X(99)   X(99)   X(99)
WILMINGTON NC  50 99   X(99)   X(99)   X(99)   X(99)   X(99)   X(99)

MYRTLE BEACH   34  3   X( 3)   X( 3)   X( 3)   X( 3)   X( 3)   X( 3)

$$                                                                  
FORECASTER BROWN                                                    


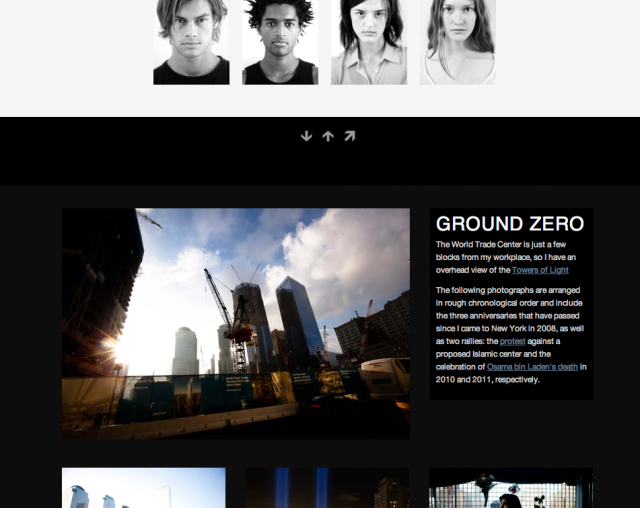
photos.danwin.com: My new portfolio site in HTML5, with responsive CSS

After trying too hard to rewrite my really old Flash gallery as a jQuery plugin, I thought “to hell with it” and decided to join the one-pager trend: http://photos.danwin.com. I have to say, this was one of the more pleasant site-designing jobs I’ve done in awhile. I’m going to try to limit my sites to one-page or fewer from here on out.

photos.danwin.com

photos.danwin.com

I started with a HTML5 template from initializr.com and then tacked on the 1140 CSS grid sheet, a fluid framework.

As far as Javascript goes, besides jQuery, I’m using Ben Alman’s throttle-debounce plugin, Leandro Vieira’s lightbox plugin, and Ariel Flesler’s scrollTo plugin for the simple interaction bits.

It’s pretty rudimentary in terms of code sophistication…I haven’t yet decided how to lazy-load the images while still providing a full page for non-JS users. I think I’ll end up tacking on backbone.js and figuring out a JSON structure to load in the “galleries”. So, for now, deal with loading some 100+ images all at once from S3…

To me, it’s an improvement over the typical slideshow galleries in which only one image at a time is shown. Maybe it’s because I don’t have enough Big Picture show-stoppers to justify displaying every photo as full-screen. But I think there’s some artistic room in manually arranging the images as a collage and purposefully deciding the size of each image in relation to the others.

The best part is that with the 1140 grid system, not only was designing for variable-width desktop browsers (and placing the images) a breeze…the site works very well on the iPad and passably well on the iPhone…and I barely even left Google Chrome on my Mac during the whole development process.

Now I just have to get some better photos. And maybe think the typography a little more…Meanwhile, check it out:

Reactions to Osama bin Laden’s death: Female and non-U.S. residents more ambivalent. Via the NYT Reactions Matrix

Obama 1, Osama 0

This (totally not-double-checked) analysis is a riff off of the excellent New York Times visualization (The Death of a Terrorist: A Turning Point?) of how people reacted to Osama bin Laden’s death. In the days following the news, the Times asked online readers to not only write their thoughts on bin Laden’s killing, but put a mark on a scatterplot graph that best described their reaction.

The Times used the data to show the continuum of reactions from everyone who participated. I wanted to see how reactions differed across geographical location and gender.

The Times collected about 13,000 reactions before closing it down. Besides the nature and content of reaction, users had the choice of leaving their names and geographical areas.

I used Google Refine to quickly sort out the geographic locations (which varied from zip codes, to city/state, to neighborhoods, such as “Upper East Side”). Gender was not a checkbox in the NYT’s form, so I used Refine to sort based on first names. More details in the methodology section.

Conclusion

The conclusion my totally-unscientific analysis came to: Among all NYT website users, there was general moral approval and optimism for killing bin Laden. This did not vary significantly among U.S. citizens, whether they were from the cities attacked on Sept. 11 or elsewhere.

However, non-U.S. NYT-website-users were less supportive of the action. This gap of moral approval also exists between male and female NYT-website-users and at roughly the same magnitude (about 10 points).

There wasn’t much variation in terms of how significant NYT-website-users believed OBL’s death would be. All demographic groups averaged about 60 (out of 100) in terms of how significant they rated OBL’s death in the war on terror.

In case you’re wondering: the 260 non-U.S.-female respondents averaged a 43 in positivity, which is a whole step below the average female response. U.S. females (2,270 of them), averaged a 52, compared to the 6,059 U.S. males who averaged a 65.

Data

I’ll just get right to the results tables.

The original graph was arranged so that its x-axis represented how positive users felt about OBL’s death and the y-axis represented how significant of an impact they thought it would have on the war on terror.

So, someone who thought that OBL’s demise was very good news and would have a strong impact on the war would be in the top right quadrant. Those who thought it was a bad deed, and would amount to nothing, would be in the bottom left. In the scatterplot, darker points correspond to more users with the same type of reaction.

I have two sections of tables. The first section consists of the basic numbers: The count of users, the average positivity rating (from 0 to 100) and the average significance rating.

The second section consists of visualizations. The first is a scatterplot similar to the NYT’s original graphic, with less granularity. The second and third plot positivity and significance ratings, respectively, on the x-axis, with the y-axis showing the relative popularity of each rating.

The most interesting graph is the female respondents': it was the only one in which the most-positive rating did not garner the most respondents. It appears that the most popular choice was on-the-fence.


Group Number Average Positivity Average Significance
All 13864 60.23 61.04
Males 7067 64.01 62.07
Females 2580 51.81 60.08
U.S. 11537 61.28 61.45
Outside U.S. 1820 53.80 59.06
U.S. non-NYC/DC 9191 61.28 61.28
NYC 1978 61.15 62.18
Washington DC 368 62.07 61.74

Graphs

A quick note: I was not as adept as the NYT at making my scatterplot more discrete and readable. The darkness of each pixel is relative to the highest respondent count in that particular group. So, the female scatterplot looks to be denser than the others, when what probably happened was that the responses were more evenly spread out.

Group Scatterplot Distribution of Positivity Distribution of Significance
All
Males
Females
U.S.
Outside U.S.
U.S. non-NYC/DC
NYC
Washington DC

Caveats

In my summary of conclusions section, I was careful to say “NYT-website-users.” The NYT reactions graph is not a random sampling of the population, or of even the NYT’s audience. It is a feature accessible only to web-users, which – if the Internet is still stereotypically male-dominated – might account for the high male-to-female ratio.

The reactions feature was a passive one, in that onus was on the readers to actually interact with the graphic and fill out a form. So this would seem to filter out most of the apathetic – or busy – crowd. Moreover, the NYT team removed any comments that were off-topic, trolling, or strongly inappropriate…so anyone who is driven to cuss when the topic is bin Laden has probably been filtered out.

I also think the nature of the graphic, having users pick out a point out of 10,000 (or so), might naturally have them gravitate towards the axes and midpoints. For example. someone might verbalize their reaction as “Meh, neither happy nor sad” and pick the exact midpoint, when they’re really more of a 4 or 6. Or, someone who is really happy that bin Laden is dead automatically goes for the farthest right spot because anything less than the highest positivity scale would indicate some kind of partial sympathy for bin Laden. Each scatterplot graph reflects this, with the darker spots collecting around the extremes.

And if you want to be part of the “NYT’s a bunch of liberal-brie-eaters” crowd, then it’s possible that the entire respondent base is slanted leftwards politically. I thought it would be interesting to see if results varied by red and blue states, but I think that a red-state fan of the NYT is probably not much different than a blue-state fan. And, it would’ve have taken way more time to sort out by state.

So with that said, this survey is not at all an accurate reflection of the general population, compared to a general poll. Still, it’s interesting to see that even within this select sample group, there is a large disparity between males and females, and U.S. and non-U.S. But again, we can’t really make any sweeping generalizations, such as: “Women are less positive about killing” or that “Foreigners are against American unilateral raids.” without prefacing it with “Women who use the New York Times’ website and who are opinionated enough to participate in their interactive graphic are…”

Methodology

I used Google Refine to quickly cluster around geographic locations and first names. To decide whether a user was in the U.S. or not, I used regular expressions to quickly find all the location entries with postal or AP-style state abbreviations. To filter for NYC users, I used regular expressions that looked for “NY” and rejected any that specifically stated a non-NYC city, such as Poughkeepsie. And I also just did a search for all well-known NYC neighborhoods. Finding DC was mostly just looking for “DC”

Gender was a little bit trickier. I found the easiest way was to Google for a list of the most common male and female names and do a large regular expression to filter for them. I rejected names that could belong to either gender, such as “Pat” or “Kim”. And for names that I wasn’t sure of, I just didn’t include them in the sample, so this means foreign and rare names weren’t part of the mix.

For both geography and names, I ended up rejecting most values that didn’t have a count of at least 2 or 3. So the upshot is, people with common names, like “John”, are more represented than those with relatively uncommon names, like “Leopold.”

I used RMagick to generate the scatterplots and Google Image Charts API for the bar graphs.

I’ve said it before and I’ll say it again, for geeky data analysis, Google Refine is a godsend.

A sidenote: The Jessica Dovey quote, misattributed to Martin Luther King Jr., “I will mourn the loss of thousands of precious lives, but I will not rejoice in the death of one, not even an enemy,” made an appearance 42 times in the NYT response matrix.