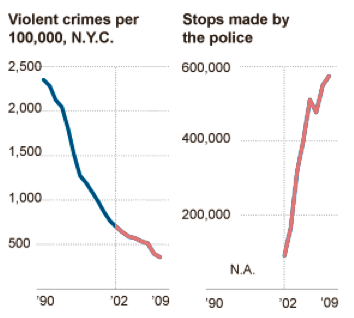
Update: This redditor said “I find it amusing that an article about misleading graphics uses a misleading graphic of its own,” when in fact, my edited graphic was not misleading, it was just wrong. Corrected now.
This is a week old, but still worth revisiting for just ‘what-the-Fourth-Amendment’ kicks: Until last week, the New York Police Department was allowed to not only stop-and-frisk just about anyone for reasons as vague as “furtive movement” , but store each friskee’s personal info in a personal database. The New York Times puts out an overlay of the NYPD’s stop-and-frisks citywide on top of a Google Map, making it easy to see how many times (mostly male minorities) were stopped on your street.
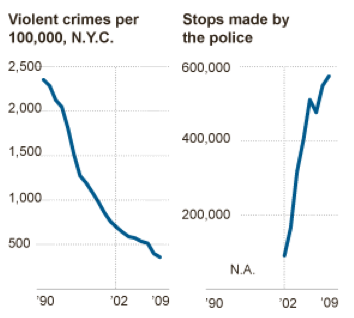
Below the fold is this interesting, awe-inspiring graphic. On the left is violent crimes per 100,000 in NYC. At the right is the number of stops made by police.
Next to each other, just after breakfast on a Monday morning, the sharply declining and climbing graphs seem to imply that, hey, even if the stop-and-frisks are an invasion of the truly innocents’ privacy, a wedge between cops and the neighborhoods they patrol, and quite possibly, a waste of time, it does seem that crime has dropped pretty quickly, even as stops increased to nearly 600,000 in 2009.
But wait, the stops-graphic is only plotted from 2002 to 2009, whereas the violent crime rate goes back to the Giuliani era. To be fair to the NYT, they do use the same time scale, but at a glance on a graphic-busy page, it’s easy to miss that. Also, in the NYT’s favor, if you did notice the difference in plotting lengths, it really drives home the lack of correlation.

Using the stops-graphic and the related story, we estimate there were about 97,000 stops in 2002, and 580,000 stops in 2009, resulting in a nearly 600% increase in an eight year span, or about 75% a year. The violent-crime rate graphic appears to go between 700/100k in 2002, to 400/100k in 2009…which is about a 43% drop over eight-years, or roughly 5.4% per year.
And to get this amazing return-on-investment, all you have to do is sacrifice a little of the community’s goodwill towards the police, a likely consequence when stopping people for things like spitting on the sidewalk.
Other fun facts. “Furtive movement” was the reason for about 44% of the stops (“Bulge” was a reason in 9.5%).
A 40+% drop in the violent rate of crime is nothing to sneeze at, even over 8 years. In retrospect, though, it makes the NYT’s dataline choice even more justifiable: that 40 percent drop came after what looks like a 340% drop in crime over a 12 year period.
In any case, the country is, for better or worse, based on certain principles that limit police power even if stopping and frisking everyone who walks out their door could result in a drop in crime. From another story, 9 in 10 people stopped were not accused of anything.
And yet, just being stopped was reason enough to have your name and address stored into a permanent police database even, to repeat again, if you were completely innocent and just happened to be judged by the police to have “furtive movements” or a “bulge”.
Last week, though, Gov. Paterson signed a law stopping the storing of innocents’ personal info:
“There is a principle – which is compatible with the presumption of innocence, and is deeply ingrained in our sense of justice – that individuals wrongly accused of a crime should suffer neither stigma nor adverse consequences by virtue of an arrest or criminal accusation not resulting in conviction,†Mr. Paterson said.
